["Thank you" to the blog reader who posted this solution here.]
In a previous post, I described how a Text Field can be added to a Row Group in a JasperReports Crosstab in order to provide a sequence number. I suggested developing a small Java class that would be incremented with each evaluation of the Text Expression. As each Row Group was printed, the current value of the Text Expression would be printed and incremented: 1, 2, 3.
However, this recommendation had the downside of requiring a Java class. If you're not familiar with Java, this might be a major obstacle. Even if are familiar with Java, developing a class and carrying a JAR file throughout your deployments (the packaging of a Java class) isn't desirable. This is especially true when you can add this functionality to your report with a few variable definitions.
The Result
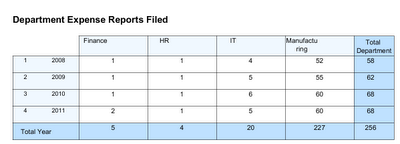
This Crosstab has a Row Group 'Year'. And with each Year (2008-2011), there is a sequence printed (1-4). This post shows how to create a Crosstab.
 |
| A Crosstab with a Year Row Group and a Sequence |
Report Variable
To add the sequence, start by adding a Report Group to the report. In this example, the Crosstab is added to the Summary Band. Adding a Report Group "YEAR_GROUP" will create a Report Variable "YEAR_GROUP_COUNT".
Next, add your own variable, in this case "CROSSTAB_ROW_COUNTER". Set the values in accordance with the following screenshot. Notice the dimmed Group Bands for Year which aren't required in the report. CROSSTAB_ROW_COUNTER references YEAR_GROUP_COUNT.
 |
| YEAR_GROUP_COUNTER Created via the Report Group Wizard and the User-Defined CROSSTAB_ROW_COUNTER |
Crosstabs lack the ability to inject Report Variables into their Text Field Expressions. However, Parameters and Measures can go into Text Field Expression and Parameters and Measures do have access to the global Report Variables. This Measure is defined to allow a Text Field this access. The Measure is called "ROW_COUNTER" and is linked to CROSSTAB_ROW_COUNTER.
 |
| Defining a Measure to Provide Access to a Variable |
Text Field
Finally, a Text Field is dragged onto the Crosstab Row Group. The Text Field is linked to the Measure ROW_COUNTER. It can't be directly linked to the outer CROSSTAB_ROW_COUNTER; you'll get a "not found" error if you try.
I'm glad to have learned this technique because it decreases the footprint of my Jasper Report. Keep the custom Java version of the counter in mind if you have a more complicated report layout and you want to evaluate an expression without regard to other structures (Report Groups, etc) in the report.
Nice
ReplyDeleteTo add the sequence, start by adding a Report Group to the report. In this example, the Crosstab is added to the Summary Band. Adding a Report Group "YEAR_GROUP" will create a Report Variable "YEAR_GROUP_COUNT".
DeleteHow did you create it?
Very Nice, It helped me a lot
ReplyDeleteHi, if you can assist, I am not able to get the counter to start with 1, for me it is starting with 17886..dunno why?
ReplyDeleteIs 17,886 the total number of rows in your data set? Check to make sure that the Calculation is set to "Nothing" in the Measure definition and not to Count or Sum.
DeleteThanks - very useful & solved a bunch of problems that I had been struggling with.
ReplyDeleteHi Carl,
ReplyDeletePlease can you kindly advise on how to calculate these in Jasper/ireport.
1. MoM (Month on Month) Change
2. MoM Percentage
3. YTD (Year to Date) Change
4. YTD Percentage
I have variables for each of them but still give me error. I mathematical formula and implemented it in the expression.
Find attached is a sample result.
Your kind contribution is and always appreciated.
Thanks
/home/stanley/MnM Sample.jpg
Hi,
DeleteIf your data source is an RDBMS like Oracle or SQL Server, consider using the LAG function.
For example,
SELECT team, num_wins, LAG(num_wins) OVER (ORDER BY team) FROM team_results
will pass an extra field to iReport that can be used for the monthly and yearly change computations.
Good luck
Hi,
ReplyDeleteI have a crosstab with two row groups and I need to reset the counter at each new value in the outer group. I tried to change the Reset type/group fields but it does not work.
Any suggestions?
Thanks
Hi Carl,
ReplyDeleteI have performed the steps you through this post but when the report is generated variable returns me null, add the group and then create the global variable to express it in the image and then create the extent pivot table but I continued giving the null value, I reviewed the variables and are created as you indicate, perhaps they can help me with any suggestions. In advance many thanks
Thank you for your posting. When I sort by a different column in the crosstab, the row counter is all messed up as it does not get reset but shows whatever the row # it was before sorting I guess. Is there any solution for this? Thank you!
ReplyDeleteWhat you didn´t mention is that you have to assign the day field to the report group. I mean it´s pretty obvious but I almost forgot about that.
ReplyDeleteAnyway great solution. Still works in Version 7.3